The harsh northern region is beautiful and distant. These definitions fully apply to the Yamalo-Nenets Autonomous Okrug. On this land, surrounded by pristine nature, indigenous peoples live according to the customs of their ancestors, and the rich mineral resources are developed using modern technologies. Yamal has always attracted travelers with its unique appearance. Here, the stinginess of the sun and the originality of nature, the severity of the climate and the hospitality of the local residents, the fantastic palette of autumn and the silent whiteness of winter are combined in the most amazing way. Scientists love Yamal for its cultural richness and unique nature. Therefore, be sure to come to the Yamalo-Nenets Autonomous Okrug (capital Salekhard) to enjoy the cleanest air and see more closely the beauty of remote corners of our big country.
Geography
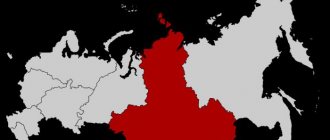
Russia is beautiful and rich: the Yamalo-Nenets Autonomous Okrug is the black pearl of the northern part of our country. And it occupies no less than 770 thousand square kilometers of the West Siberian Plain. The district includes: the Gydansky Peninsula, the Tazovsky Peninsula and, of course, the Yamal Peninsula. Most of the district is located beyond the Arctic Circle. From the north, the Yamal-Nenets Autonomous Okrug is washed by the Kara Sea, from the south it is adjacent to the Khanty-Mansi Autonomous Okrug, its eastern neighbors are the Taimyr and Evenki Autonomous Okrug, and from the west it borders on the Arkhangelsk Region and the Komi Republic. The relief of the Yamal-Nenets Autonomous Okrug can be divided into flat and mountainous. All three peninsulas are dotted with small rivers, hollows, ravines and swamps. The mountain range stretches for two hundred kilometers in a narrow strip along the Polar Urals. The climate of the Yamal-Nenets Autonomous Okrug is sharply continental, harsh, and is divided into three zones: the northern zone of the West Siberian Lowland, subarctic and arctic. The population is approximately 500 thousand people with a density of less than one person per square kilometer.
Text
Among the gray polar latitudes, Where blizzards rule the eternal ball, Snow-covered Yamal rises as a hero of legendary pasts!
Harsh region! Stronghold of the Power! You are getting stronger every year. Yamal is a treasure and glory, and the pride of my Motherland!
Your motto is everything for a person! And, ready for new exploits, You solve the problems of the century, Keeping the traditions of your fathers!
Harsh region! Stronghold of the Power! You are getting stronger every year. Yamal is a reliable son and glory, and the pride of my Motherland!
The land of discovery and daring. The imperious call of the endless tundra, Where the lights of Yamal cities argue with the northern lights.
Harsh region! Stronghold of the Power! You are getting stronger every year. Yamal is my love and glory, and the pride of my Motherland!
Words by L.V. Khodunova
Music by Y.R. Junkerova
Anthem of the Yamal-Nenets Autonomous Okrug:
Your browser is not supported
Anthem of the Yamal-Nenets Autonomous Okrug without words:
Your browser is not supported
Flora
The vegetation cover in the Yamal-Nenets Autonomous Okrug has a pronounced latitudinal zonation. Five landscape zones can be distinguished: northern taiga, forest-tundra, shrub, moss-lichen and arctic tundra. In the northernmost, arctic zone, vegetation is very sparse. Here you can only find mosses, lichens and sedges. Small bushes and herbs are already growing in the moss-lichen tundra. In the next zone (shrub tundra) dwarf birches and willows grow, and berries and mushrooms grow along the rivers. There are many swamps and small rivers in the forest-tundra. Dwarf birches, larches, and small spruce trees grow here. In the southernmost zone of the Yamalo-Nenets Autonomous Okrug - the taiga, there are many lakes, swamps, and rivers. The entire territory is covered with dense light and dark coniferous forests.
Attractions
The peninsula has interesting sights that are worth seeing during a trip to the permafrost region.
Construction "Permafrost"
The structure is located in the village of Novy Port in the Yamal region. This is the world's largest natural refrigerator; it was created for storing catch in the middle of the last century. The caves, carved out of permafrost, are more than 1 km long. The temperature here stays no more than -15 °C all year round.
It consists of 200 individual caves with a total volume of 3,200 cubic meters. m. Since 2007, the permafrost area has been under state protection.
Stella "66th parallel"
The stella was installed on the Airport-Salekhard highway in 1980. It is a geographical symbol of Salekhard and was installed at the site where it passes through the Arctic Circle.
Victory Park
Victory Park, dedicated to the feat of the Soviet people over Nazi Germany, was founded in 2015.
It covers an area of 15 hectares, on which are installed:
- pantheon with a lit eternal flame;
- Chapel of Alexander Nevsky;
- sculpture dedicated to Archangel Michael;
- "War Road" monument;
- Walk of Fame;
- monument to a grieving soldier;
- exhibition of military equipment.
Mineral natural resources
The Yamalo-Nenets Autonomous Okrug (capital Salekhard) is famous for its hydrocarbon reserves. About 78% of the total reserves of Russian oil and gas are concentrated here. The Yamal-Nenets Autonomous Okrug is the world's largest hydrocarbon resource base. Developments for the extraction of valuable raw materials are being carried out at the Nakhodka and Urengoy gas fields, Ety-Purovskoye, Yuzhno-Russkoye, Yamburgskoye oil fields. In the Yamal-Nenets Autonomous Okrug, about 8% of the total production of “black” and about 80% of “blue gold” is produced annually. In the Polar Urals, chromium, molybdenum, tin, iron, lead, phosphorites, barites and other minerals are mined.
Historical facts
For a long time, people have strived to conquer the lands of Western Siberia; colossal efforts and large sums of money were invested in this. It is believed that by the middle of the 17th century, almost the entire territory of the Taimyr region (with the exception of the northernmost outskirts) was well studied by the Russians.
The route by sea to Siberia along the northern coast of Europe was mastered by the Russians in the period from the 9th to the 11th centuries, and by the Eastern Slavs from the 5th to the 6th centuries.
The first discoverer of the Yamal lands was a Novgorod governor named Alexander Abakumovich, who in 1364 was able to cross the Polar Urals and reach the Ob Bay.
After him, the missionary and icon painter Stefan of Perm, passing through the Vychegda and Northern Dvina, began to spread Orthodox teaching throughout the entire territory up to the Vychegda. Thanks to him, the Komi land became part of the Moscow principality by the end of the 14th century.
The most interesting geographical facts were collected by the traveler and diplomat Grigory Istoma, who also served as a translator at the court of Prince Ivan III of Muscovy. He collected a large number of facts about the life of the Sami, the White Sea-Kuloi plateau, Cape Svyatoy Nos and the Rybachye Peninsula. In 1525, thanks to the Russian diplomat Dmitry Gerasimov, the first geographical map of the Arctic Ocean basin was compiled, from the Northern Dvina to the Ob River.
The Yamal Peninsula was indicated on the map of Russia around the same time. Yamal on the document most comprehensively reflected all the achievements of sailors and explorers of the Middle Ages. Many written sources of that time describe the campaigns of Russian Pomors to the Spitsbergen archipelago, which was being developed along with the Land of Siberia and Novaya Zemlya.
The first foreign pioneer was the Englishman Stephen Borrow, who reached Novaya Zemlya in 1556.
The most famous expeditions during the Middle Ages to the lands of Yamal:
| Expedition leader | Trip date | Purpose of Travel |
| Berezovsky voivode Nikita Trakhaniotov | 1595 | He reached the Poluy River and, near its confluence with the Ob River, built the first wooden fort, which is considered the first Russian settlement in Siberia. Later it received the name Obdorsk Fortress, which later became the city of Salekhard - the only settlement located on the Arctic Circle. |
| A native of the Northern Dvina, Kondraty Kurochkin | 1610 | He went down the Yenisei down to the mouth of the river and by sea reached Pyasina. |
| Sagittarius Ivan Sorokin | 1667 | At the beginning of the Yenisei-Khatanga waterway he founded the village of Dudinskoye. |
| Cossack centurion Pyotr Beketov | 1632 | Founded a fortified point called the Yakut fort. |
| Foreman Elisey Luza | 1639 | I walked the Yana River from the very top to its mouth. |
| Cossack centurion Ivan Erastov | 1640 | He crossed the Indigirka River and reached the Alazeya River by sea. |
| Yenisei Cossack Mikhail Stadukhin | 1641 | I went to explore the New Lands. |
| Yenisei Cossack Mikhail Stadukhin | 1643 | By sea he was the first to reach the delta of the Kolyma River, opening 500 km of the coast of Northern Asia and the Kolyma Bay. |
| Yakut Cossack Semyon Dezhnev | 1648 | He circumnavigated the northeastern tip of Asia, crossed the Bering Strait, and became the founder of the Anadyr fort. |
By the end of the 16th century, after losing access to the shores of the Baltic Sea, the north became the only route of trade with European countries.
By that time, cities had already been founded:
| City name | Date of foundation |
| Arkhangelsk | 1584 |
| Tyumen | 1586 |
| Tobolsk | 1587 |
| Mangazeya | 1601 |
During the reign of Peter I, active geographical and geological studies of the lands were carried out. In 1725, the “First Kamchatka Expedition” was organized, the main task of which was to explore the Arctic and Pacific oceans. The head of the expedition, which checked the existence of a strait between America and Asia, was a Dane named Vitus Bering, who was invited to serve in Russia.
In 1713 and 1714, the Russian figure Fyodor Saltykov proposed a project for a sea route through the northern seas from the city of Arkhangelsk to China. An expedition of 10 separate detachments was organized, which for 11 years (from 1733 to 1744) under the leadership of Alexei Chirikov and Vitus Bering mapped and took photographs of the entire coast of the White Sea up to Kamchatka. During this expedition Taimyr was discovered.
The land exploration of the area took place under the leadership of Semyon Chelyuskin, who in May 1742 reached the northern tip of Asia. The main event of this expedition was the discovery of the Aleutian Islands in 1742.
In 1783, researcher Grigory Shelikhov studied the entire northern part of the Pacific Ocean in more detail, thanks to which Alaska and the Aleutian Islands were annexed to Russia.
Subsequently, expeditions were organized to New Lands:
| Supervisor | Baht hikes |
| Fyodor Litke, Peter Pakhtusov and August Tsivolsky | 1822 – 1835 |
| Peter Anzhu and Ilya Berezhnykh | 1821 – 1822 |
| Ferdinand Wrangel and Fyodor Matyushkin | 1821 – 1824 |
| Yakov Sannikov and Nikolai Belkov | 1800 – 1808 |
On the map of Russia, the first most detailed information about the geography and geology of the Yamal Peninsula was published in his work entitled “Journey to the North and East of Siberia” by Russian scientist and academician Alexander Middendorf.
His achievements were:
- Information about the basics of the biological ecology of the place;
- Evidence of zonal distribution of vegetation in the territory;
- Data on the Taimyr Evenks, Dolgans, Nganasans and northern Yakuts;
- Classification of tundra zones and characteristics of the climate of Siberia.
At the end of the 19th century, until the middle of the 20th century, the following expeditions took place:
| Expedition leader | Year |
| Andrey Vilnitsky | 1894 |
| Stepan Makarov | 1899 |
| Fridtjof Nansen | 1893 – 1896 |
| Feodosius Chernyshev and Vladimir Rusanov | 1907 – 1913 |
| Georgy Brusilov | 1912 – 1914 |
| Georgy Sedov | 1912 – 1914 |
| Alexander Bunge | 1900 |
| Eduard Toll | 1902 |
| Vladimir Rusanov | 1912 |
| Rudolf Samoilovich | 1928 |
| Andrey and Boris Vilkinsky | 1913 |
Indigenous peoples of the Yamalo-Nenets Okrug
Today twenty peoples live in the Yamal-Nenets Autonomous Okrug. But the true indigenous inhabitants are the Khanty, Nenets, Selkup and Komi-Izhemtsy, who have lived in this territory since time immemorial. The rest settled only in the second half of the twentieth century. This is due to the development of the territories of the Far North during the era of the Soviet Union.
Khanty: this people have lived since ancient times in the territories of the Khanty-Mansiysk and Yamalo-Nenets Autonomous Okrug. The culture, language and customs of this people are very heterogeneous. This is due to the fact that the Khanty settled over a fairly vast territory and therefore became somewhat scattered.
The Nenets inhabit a vast territory of Russia - from the Taimyr Peninsula to the coast of the Arctic Ocean. These people migrated from southern Siberia in the first millennium AD. He belongs to the Samoyed group.
It is known that the Komi people have lived in this territory since the 1st millennium BC. This people is divided into northern and southern Komi. From time immemorial, the first people were engaged in reindeer herding, fishing and hunting. The second were hunters and fishermen.
The Selkups are the most numerous people of the North. The Selkups traditionally engaged in fishing and hunting. Those representatives of the people who lived at higher latitudes also bred deer.
The history of cold Yamal
The first mention of the Yamal land dates back to the 11th century, but Novgorod merchants managed to get there earlier. Their references to the northern lands were fantastic. Travelers spoke of squirrels and deer that fell to the ground like raindrops from clouds. It was from this moment that the popularity of Yamal began to grow.
In order to finally conquer the rich northern lands, Tsar Fedor sent a campaign in 1592. A few years later, a Cossack detachment created a fortification called Obdorsk. Today everyone knows this place as Salekhard, a city that is the capital of the Yamalo-Nenets Okrug. After the northern lands were conquered and passed to Russia, the rapid growth of the power of this state began.
Administrative center
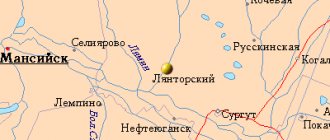
The capital of the Yamal-Nenets Autonomous Okrug is the city of Salekhard. It was located on the bank of the Ob (on the right side). The city is located on the Arctic Circle (the only one in the world). The population is about 40 thousand people. The city was founded in 1595. At first it was a small fort called Obdorsky. Half a century after its founding, permanent residents appear here. Since 1923, the village of Obdorsk has become the center of the Obdorsky district of the Ural region. And already in 1930, the village was given the status of the administrative center of the Yamalo-Nenets Autonomous Okrug. Three years later, Obdorsk was renamed Salekhard. Nowadays, the Yamalo-Nenets Autonomous Okrug, the capital of the Autonomous Okrug in particular, is developing at a fairly rapid pace. There are many enterprises in the city: Yamalzoloto, a river port, a fish canning factory and others. The Yamal-Nenets District Museum and Exhibition Complex has been opened in the city, which houses an exhibition center, a local history museum and a scientific library. Also in Salekhard is the District House of Crafts, a state budgetary cultural institution of the Yamalo-Nenets Autonomous Okrug. There are many branches of various universities in the capital of the Yamal-Nenets Autonomous Okrug. It should be noted that the Yamalo-Nenets Autonomous Okrug (capital Salekhard) is experiencing great problems with Internet access. The fact is that there is no fiber optic network in the region yet.
Permafrost Treasure
Many people call the Yamal Peninsula a gas cylinder, but residents are not offended by this comic nickname. They only correct it by saying that their autonomous region is the gas heart of Russia. There really is so much gas here that it even comes to the surface.
Photographs were taken here of a funnel with a diameter of 60 meters. This natural phenomenon made this place famous, but did not surprise experts at all. Such craters very often appear in permafrost, which contains a large supply of natural gas. The Yamal Peninsula is just such a place. A photo of the famous funnel is in front of you.
In the pre-war years, the main sectors of the economy were reindeer husbandry and fishing. Fur harvesting increased rapidly. However, as soon as the district was formed, a completely new branch began to develop - crop farming. People began to grow fodder root crops, potatoes and vegetables.
Cities and districts of the Yamalo-Nenets District
The Yamal-Nenets Autonomous Okrug consists of seven districts, eight cities, five urban-type settlements and forty-one rural administrations. Districts of the Yamalo-Nenets Autonomous Okrug: Yamalsky, Shuryshkarsky, Tazovsky, Purovsky, Priuralsky, Nadymsky and Krasnoselkupsky. As mentioned above, the population density is very low. Despite the vast territory, there are very few cities in the Yamalo-Nenets Autonomous Okrug. Cities: Noyabrsk (97 thousand), Novy Urengoy (89.8 thousand), Nadym (45.2 thousand), Muravlenko (36.4 thousand), Salekhard (32.9 thousand), Labytnangi (26, 7 thousand), Gubkinsky (21.1 thousand inhabitants). Some cities of the Yamal-Nenets Autonomous Okrug will be described in more detail below.
YAMAL-NENETS AUTONOMOUS DISTRICT
| Territory area - 769.3 thousand km2 Distance from Salekhard to Moscow - 2436 km In the north - the climate of the Arctic zone In the center - the climate of the subarctic (marine) In the south - the climate of the temperate zone (Atlantic-continental) Average temperature in January 2011: -21.4° C Average temperature in July 2011: +9.5° WITH Population (estimated as of January 1, 2012), thousand people: total population - 536.6 urban - 455.9 rural - 80.7 National structure of the population (according to the census as of October 14, 2010), percent of the population indicating nationality: Russians - 61.7 Ukrainians - 9.7 Nenets - 5.9 Tatars - 5.6 Khanty - 1.9 Azerbaijanis - 1 .8 Bashkirs - 1.7 Belarusians - 1.3 Komi - 1.0 Moldovans - 0.9 Kumyks - 0.9 Nogais - 0.7 Chuvash - 0.7 Chechens - 0.5 Mari - 0.4 Selkups - 0 .4 Lezgins - 0.4 Germans - 0.4 Kyrgyz - 0.4 Uzbeks - 0.3 Armenians - 0.3 Kazakhs - 0.3 other nationalities - 2.8 Largest cities (number of inhabitants - estimate as of January 1, 2012), thousand people: Salekhard — 44.3 Novy Urengoy — 112.2 Noyabrsk — 109.2 Nadym — 47.4 Muravlenko — 33.5 | |
| Population density (as of January 1, 2012) - 0.7 people per 1 km2 Municipalities (as of January 1, 2012) - 58 including: municipal districts - 7 urban districts - 6 urban settlements - 7 rural settlements - 38 | |
DISTRIBUTION OF THE NUMBER OF MIGRANTS BY MAIN FLOW OF MOVEMENT IN 2011
ECONOMY OF THE AUTONOMOUS DISTRICT in 2011
In the structure of the gross regional product in 2010, the main types of economic activity were: mining - 48.2%; construction - 14.7; wholesale and retail trade; repair of vehicles, motorcycles, household products and personal items - 9.8; transport and communications - 7.7%.
The industrial production index compared to 2010 was 101.1%, by type of activity “Mining” - 99.4%, “Manufacturing” - 111.0, “Production and distribution of electricity, gas and water” - 112 ,1%. In terms of the volume of shipped goods of its own production, work and services performed on its own in the extraction of mineral resources, the Autonomous Okrug ranks 3rd in Russia (in the federal district - 3), in manufacturing - 49(5), in the production and distribution of electricity, gas and water — 34(5).
The Autonomous Okrug accounts for over 80% of the all-Russian production of natural and associated gas.
In agriculture, reindeer husbandry, fur farming, and fur farming are developed.
Retail trade turnover amounted to 87.5 billion rubles, or 101.5% (in comparable prices) by 2010. In terms of retail trade turnover per capita, the Autonomous Okrug took 6th place in the Russian Federation (in 2010 - 4th place ). In the structure of retail trade turnover, the share of food products, including drinks, and tobacco products was 63.1%, non-food products - 36.9% (in 2010 - 58.3 and 41.7%, respectively).
The turnover of public catering amounted to 11.4 billion rubles, or 93.4% (in comparable prices) by 2010.
The balanced financial result (profit minus loss) of the organizations’ activities amounted to 150,679 million rubles.
In the volume of investments in fixed assets, 22.2% were borrowed from own funds, 77.8% from borrowed funds.
The economy of the Autonomous Okrug received 4,801,365 thousand US dollars from foreign investors.
The foreign trade turnover of the Autonomous Okrug amounted to 3026.9 million US dollars, including exports - 2755.9 million US dollars or 6.4 rubles. to the level of 2010, imports - 271.0 million US dollars and 150.1%.
| SHARE OF THE AUTONOMOUS DISTRICT IN THE ALL-RUSSIAN BASIC ECONOMIC INDICATORS | STRUCTURE OF GROSS REGIONAL PRODUCT BY TYPE OF ACTIVITY1) (at current basic prices) |
* * * * * * 1) 2010
| STRUCTURE OF THE VOLUME OF SHIPPED OWN PRODUCED GOODS, WORK AND SERVICES PERFORMED BY PROCESSING INDUSTRIES BY TYPE OF ACTIVITY | SHARE OF PLANT AND ANIMAL PRODUCTS IN AGRICULTURAL PRODUCTS
|
| STRUCTURE OF FOREIGN TRADE | STRUCTURE OF MONEY INCOME OF THE POPULATION (as a percentage of the total cash income of the population) |
MAIN SOCIO-ECONOMIC INDICATORS
| 1990 | 1995 | 2000 | 2003 | 2004 | 2005 | 2006 | 2007 | 2008 | 2009 | 2010 | 2011 | |
| POPULATION | ||||||||||||
| Population1) (end of year estimate), thousand people | 488,6 | 487,1 | 498,3 | 510,8 | 514,6 | 517,4 | 521,6 | 524,0 | 523,0 | 524,1 | 524,9 | 536,6 |
| including: | ||||||||||||
| men | 252,9 | 250,2 | 251,8 | 256,1 | 257,7 | 258,6 | 260,2 | 260,8 | 259,7 | 259,9 | 260,1 | 270,0 |
| women | 235,7 | 236,9 | 246,5 | 254,7 | 256,9 | 258,8 | 261,4 | 263,2 | 263,3 | 264,2 | 264,8 | 266,6 |
| Of the total number - population of working age1), thousand people | 318,9 | 329,9 | 348,3 | 365,8 | 371,4 | 375,3 | 379,3 | 378,5 | 374,5 | 370,5 | 367,6 | 376,1 |
| Number of births per 1000 population2) | 16,4 | 13,1 | 11,7 | 14,1 | 14,2 | 13,9 | 13,5 | 14,7 | 15,1 | 15,7 | 15,8 | 15,6 |
| Number of deaths per 1000 population2) | 3,3 | 6,4 | 5,6 | 6,1 | 5,8 | 6,0 | 5,8 | 5,6 | 5,7 | 5,6 | 5,5 | 5,4 |
| Natural increase, decrease (-) per 1000 population2) | 13,1 | 6,7 | 6,1 | 8,0 | 8,4 | 7,9 | 7,7 | 9,1 | 9,4 | 10,1 | 10,3 | 10,2 |
| Life expectancy at birth2), number of years: | ||||||||||||
| the entire population | … | 63,46 | 66,71 | 66,46 | 67,50 | 67,58 | 67,96 | 69,06 | 69,10 | 69,82 | 70,05 | 70,16 |
| men | … | 58,41 | 61,64 | 61,43 | 62,52 | 61,99 | 63,55 | 64,86 | 64,51 | 65,70 | 65,59 | 65,62 |
| women | … | 69,84 | 72,28 | 72,22 | 72,85 | 73,72 | 72,53 | 73,77 | 73,76 | 74,42 | 74,57 | 74,88 |
| WORK | ||||||||||||
| Average annual number of people employed in the economy, thousand people | 312,7 | 353,0 | 357,3 | 359,7 | 355,9 | 357,2 | 367,3 | 368,5 | 367,8 | 370,5 | ||
| Number of employees employed in state bodies and local governments, thousand people | 4,2 | 6,8 | 8,8 | 9,3 | 10,5 | 11,4 | 11,2 | 11,5 | 11,7 | 11,5 | 11,3 | |
| Number of unemployed, thousand people | 25,8 | 16,8 | 19,7 | 22,3 | 16,9 | 8,6 | 19,3 | 14,8 | 14,1 | 12,1 | ||
| Unemployment rate, percent | 8,6 | 5,5 | 6,5 | 7,1 | 5,4 | 2,7 | 5,7 | 4,6 | 4,4 | 3,7 | ||
| Number of unemployed citizens who applied for assistance in finding suitable work at state employment institutions (at the end of the year), thousand people | 8,7 | 7,5 | 8,2 | 9,7 | 9,1 | 7,5 | 6,1 | 5,1 | 6,4 | 5,5 | 4,3 | |
| of them are recognized as unemployed | 7,8 | 7,2 | 7,7 | 9,2 | 8,6 | 7,0 | 5,2 | 4,5 | 6,0 | 5,3 | 3,9 | |
| LIVING STANDARD OF THE POPULATION AND SOCIAL SPHERE | ||||||||||||
| Average per capita cash income2) (per month), rub. | 7562,6 | 16027,2 | 19106,8 | 22230,7 | 27665,0 | 32589,9 | 39568,6 | 40196,3 | 42675,9 | 46669,9 | ||
| Real cash income of the population, as a percentage of the previous year | 119,5 | 109,5 | 109,4 | 101,0 | 108,8 | 110,8 | 110,6 | 91,5 | 98,8 | 105,2 | ||
| Average consumer spending per capita2) (per month), rub. | 2841,6 | 6327,9 | 8113,1 | 10920,1 | 14106,0 | 17722,7 | 22380,9 | 20670,1 | 20643,0 | 22295,2 | ||
| Average monthly nominal accrued wages of employees of organizations, rub. (1990, 1995 - thousand rubles) | 0,640 | 1758,8 | 8964,7 | 20027,2 | 23890,2 | 27534,1 | 32336,4 | 37363,5 | 44168,7 | 46480,5 | 52618,8 | 59095,3 |
| Average size of assigned pensions, rub. (1995 - thousand rubles) | 353,5 | 992,3 | 2342,7 | 3069,2 | 3917,1 | 4367,0 | 5555,3 | 7031,3 | 9594,7 | 11512,5 | 12644,1 | |
| Real size of assigned pensions, as a percentage of the previous year | 111,9 | 112,4 | 116,8 | 108,2 | 101,4 | 116,4 | 113,1 | 126,7 | 111,8 | 107,1 | ||
| Number of pensioners, thousand people | 46 | 67 | 76 | 82 | 88 | 93 | 97 | 100 | 106 | 111 | 116 | |
| The share of the population with monetary incomes below the subsistence level in the total population of the subject2), percent | 11,1 | 8,0 | 7,1 | 8,4 | 6,8 | 6,5 | 6,2 | 7,4 | 7,5 | 7,5 | ||
| Total area of residential premises per inhabitant on average2) (at the end of the year) - total, m2 | 14,6 | 16,2 | 17,2 | 17,5 | 17,6 | 17,8 | 17,9 | 18,3 | 18,7 | 19,1 | 19,2 | 19,0 |
| in urban settlements | 13,6 | 16,6 | 17,7 | 18,2 | 17,9 | 18,0 | 18,1 | 18,5 | 18,9 | 19,3 | 19,3 | 19,0 |
| in the countryside | 19,0 | 14,5 | 14,8 | 14,2 | 15,9 | 16,4 | 16,7 | 17,1 | 17,6 | 18,0 | 18,4 | 18,6 |
| Number of citizens using social support to pay for housing and utilities, thousand people | 87,9 | 80,6 | 88,1 | 59,3 | 66,5 | 89,4 | 90,8 | 80,1 | 82,1 | 83,2 | ||
| Average monthly amount of social support per user, rub. | 56 | 288 | 333 | 562 | 589 | 572 | 647 | 1089 | 1207 | 1316 | ||
| Number of families who received subsidies to pay for housing and utilities, thousand. | 4,6 | 10,1 | 11,0 | 9,8 | 9,2 | 5,3 | 4,6 | 5,3 | 5,6 | 6,0 | ||
| Average monthly amount of subsidies per family, rub. | 146 | 1246 | 1252 | 1549 | 1805 | 1945 | 1821 | 2410 | 2576 | 2682 | ||
| Number of children registered for placement in preschool educational institutions: | ||||||||||||
| total, man | 3502 | 1968 | 4236 | 5590 | 6510 | 7532 | 10185 | 12526 | 13552 | 14643 | 16163 | |
| per 1000 children aged 1-6 years2) | 82,8 | 50,0 | 110 | 143 | 162 | 181 | 242 | 292 | 308 | 327 | 353 | |
| Enrollment of children in preschool educational institutions2), as a percentage of the number of children of the corresponding age | 82,7 | 81,1 | 68,8 | 71,5 | 71,3 | 70,0 | 68,2 | 68,7 | 67,6 | 67,5 | 67,1 | 67,4 |
| Number of general education institutions (excluding evening (shift) general education institutions) (at the beginning of the school year) | 127 | 144 | 156 | 153 | 150 | 149 | 148 | 146 | 142 | 142 | 137 | 136 |
| Number of students in general education institutions (excluding evening (shift) general education institutions), thousand people | 89 | 95 | 93 | 85 | 82 | 78 | 75 | 72 | 70 | 69 | 69 | 69 |
| Number of educational institutions of primary vocational education | 8 | 7 | 7 | 7 | 7 | 6 | 6 | 5 | 6 | 6 | ||
| Number of students in educational institutions of primary vocational education, thousand people | 3,4 | 3,6 | 3,8 | 3,6 | 3,6 | 3,2 | 3,0 | 3,0 | 3,2 | 3,2 | ||
| Number of students in educational institutions of secondary vocational education - total, thousand people | 4,6 | 5,7 | 6,8 | 6,1 | 5,9 | 4,6 | 4,8 | 5,9 | 5,7 | 5,6 | 5,6 | 5,9 |
| of which state and municipal | 4,6 | 5,7 | 5,8 | 5,0 | 4,9 | 4,6 | 4,8 | 4,9 | 4,7 | 4,6 | 4,6 | 4,9 |
| Number of students in educational institutions of higher professional education - total, thousand people | 11,7 | 12,6 | 14,7 | 13,4 | 12,1 | 12,4 | 11,4 | 11,6 | 10,4 | |||
| of which state and municipal | 10,8 | 11,7 | 11,5 | 10,8 | 9,8 | 9,5 | 8,4 | 8,0 | 7,1 | |||
| Number of doctors, people: | ||||||||||||
| total, thousand | 1,7 | 1,9 | 2,2 | 2,5 | 2,6 | 2,7 | 2,6 | 2,6 | 2,6 | 2,7 | 2,7 | 2,6 |
| per 10,000 population2) | 34,8 | 38,7 | 44,2 | 48,4 | 49,6 | 53,0 | 50,6 | 50,3 | 49,8 | 51,7 | 51,2 | 48,7 |
| Number of nursing staff, people: | ||||||||||||
| total, thousand | 5,9 | 6,3 | 6,5 | 6,9 | 7,1 | 7,3 | 7,2 | 7,3 | 7,2 | 7,4 | 7,3 | 7,2 |
| per 10,000 population2) | 121 | 130 | 130 | 135,3 | 137,9 | 141,5 | 139,0 | 139,9 | 137,6 | 140,3 | 139,5 | 134,3 |
| Number of hospitals | 41 | 45 | 48 | 49 | 48 | 47 | 45 | 45 | 45 | 28 | 28 | 27 |
| Number of hospital beds: | ||||||||||||
| total, thousand | 5,8 | 5,6 | 5,8 | 6,1 | 6,1 | 6,0 | 5,9 | 6,0 | 5,5 | 5,2 | 5,2 | 5,2 |
| per 10,000 population2) | 119 | 116 | 116 | 119 | 118 | 116 | 113 | 114 | 106 | 100 | 100 | 96 |
| Number of outpatient clinics | 80 | 83 | 78 | 83 | 84 | 102 | 102 | 108 | 74 | 41 | 40 | 38 |
| Capacity of outpatient clinics, visits per shift: | ||||||||||||
| total, thousand | 8,7 | 9,8 | 10,4 | 11,5 | 12,2 | 12,6 | 11,8 | 11,6 | 11,3 | 11,5 | 10,8 | 11,2 |
| per 10,000 population2) | 178 | 200 | 209 | 226 | 237 | 244 | 227 | 221 | 216 | 220 | 207 | 209 |
| Number of registered crimes: | ||||||||||||
| total, thousand | 7,6 | 8,6 | 8,5 | 9,8 | 13,5 | 13,4 | 11,8 | 10,6 | 10,1 | 9,6 | 9,4 | |
| per 100,000 population2) | 1578 | 1723 | 1661 | 1906 | 2615 | 2571 | 2261 | 2030 | 1920 | 1836 | 1770 | |
| GROSS REGIONAL PRODUCT | ||||||||||||
| Gross regional product, million rubles. | 117101 | 283181 | 355718 | 441722 | 546366 | 594679 | 719397 | 649640 | 771769 | … | ||
| Index of physical volume of gross regional product, as a percentage of the previous year | 108,5 | 100,4 | 101,2 | 104,6 | 103,5 | 105,5 | 89,8 | 110,1 | … | |||
| FIXED ASSETS | ||||||||||||
| Availability of fixed assets (at the end of the year; at full accounting value), million rubles. | 298875 | 1411989 | 1561226 | 2088400 | 2491843 | 2797387 | 3742708 | 4002082 | 4699979 | 5687176 | ||
| Commissioning of fixed assets, million rubles. | 20178 | 121027 | 123492 | 135420 | 122506 | 166726 | 207991 | 208983 | 268724 | 457432 | ||
| Depreciation rate of fixed assets3) (at the end of the year), percent | 33,7 | 51,3 | 49,3 | 50,7 | 51,9 | 52,4 | 54,1 | 55,4 | 57,0 | 56,9 | ||
| Share of completely worn-out fixed assets3) (at the end of the year; at full book value; as a percentage of the total volume of fixed assets) | 5,9 | 15,3 | 18,6 | 15,3 | 15,5 | 15,6 | 16,6 | 16,7 | 17,6 | 17,8 | ||
| ENTERPRISES AND ORGANIZATIONS | ||||||||||||
| Number of enterprises and organizations (at the end of the year; according to state registration) | 9133 | 11057 | 11603 | 12292 | 11774 | 12629 | 12911 | 13130 | 12033 | 11412 | ||
| Number of small enterprises (at the end of the year) | 3470 | 4104 | 6785 | |||||||||
| MINING, PROCESSING, PRODUCTION AND DISTRIBUTION OF ELECTRICITY, GAS AND WATER | ||||||||||||
| Number of operating organizations by type of activity (at the end of the year): | ||||||||||||
| mining | 143 | 161 | 195 | 220 | 235 | 248 | 321 | |||||
| manufacturing industries | 492 | 515 | 514 | 501 | 574 | 547 | 741 | |||||
| production and distribution of electricity, gas and water | 354 | 360 | 376 | 356 | 369 | 382 | 421 | |||||
| Volume of shipped goods of own production, performed works and services by own forces by type of activity, million rubles: | ||||||||||||
| mining | 364787 | 459580 | 464564 | 559252 | 498136 | 558134 | 671459 | |||||
| manufacturing industries | 27073 | 34582 | 39123 | 46039 | 61100 | 71151 | 97675 | |||||
| production and distribution of electricity, gas and water | 13366 | 19192 | 23107 | 26579 | 31426 | 32847 | 35527 | |||||
| Industrial production index4), as a percentage of the previous year | 96,2 | 100,2 | 107,8 | 103,1 | 98,0 | 102,9 | 95,7 | 97,7 | 89,9 | 108,2 | 101,1 | |
| Production of main types of products: | ||||||||||||
| unprocessed wood, thousand dense m3 | 14,1 | 13,5 | 12,4 | |||||||||
| live fish, fresh or chilled, thousand tons | 8,2 | 8,0 | 8,1 | |||||||||
| oil produced, including gas condensate, million tons | 37,6 | 35,9 | 35,6 | |||||||||
| natural and associated gas, billion m3 | 482 | 541 | 557 | |||||||||
| fish and processed and canned fish products, thousand tons | 11,6 | 10,3 | 10,3 | |||||||||
| non-durable bakery products, thousand tons | 16,7 | 16,4 | 16,4 | |||||||||
| timber, sawn or split lengthwise, sliced or peeled, more than 6 mm thick; railway or tram wooden sleepers, unimpregnated, thousand m3 | 5,3 | 5,0 | 8,5 | |||||||||
| electricity, billion kWh | 2,6 | 3,2 | 4,0 | |||||||||
| AGRICULTURE | ||||||||||||
| Agricultural products in farms of all categories (in actual prices), million rubles. (1995 - billion rubles) | 97 | 239 | 532 | 573 | 497 | 705 | 891 | 1256 | 1304 | 1201 | 1600 | |
| Index of agricultural production in farms of all categories5), as a percentage of the previous year | 97,1 | … | 105,0 | 107,9 | 88,4 | 86,8 | 105,3 | 101,7 | 109,1 | 102,9 | 102,7 | 112,6 |
| Sown area of all agricultural crops in farms of all categories, thousand hectares | 0,8 | 1,2 | 0,3 | 0,3 | 0,3 | 0,1 | 0,1 | 0,1 | 0,1 | 0,1 | 0,1 | 0,1 |
| Structure of the sown area of agricultural crops in farms of all categories, as a percentage of the total sown area: | ||||||||||||
| potatoes and vegetables and melons | 24,1 | 59,1 | 59,4 | 53,9 | 44,0 | 81,8 | 100 | 85,7 | 96,9 | 98,5 | 100 | 100 |
| feed crops | 75,9 | 40,9 | 40,6 | 46,2 | 56,0 | 18,2 | — | 14,3 | 3,1 | 1,5 | — | — |
| Number of livestock on farms of all categories (at the end of the year), thousand heads: | ||||||||||||
| cattle | 6,8 | 4,1 | 2,1 | 1,8 | 1,4 | 1,1 | 1,1 | 1,0 | 1,0 | 1,0 | 1,0 | 1,0 |
| including cows | 3,1 | 2,0 | 1,0 | 0,8 | 0,7 | 0,5 | 0,5 | 0,5 | 0,5 | 0,5 | 0,5 | 0,5 |
| pigs | 12,5 | 12,3 | 8,8 | 2,9 | 2,9 | 1,6 | 1,6 | 1,6 | 1,8 | 1,9 | 2,2 | 2,3 |
| sheep and goats | 0,3 | 0,4 | 0,1 | 0,1 | 0,1 | 0,1 | 0,1 | 0,1 | 0,1 | 0,1 | 0,1 | 0,0 |
| Production in farms of all categories, thousand tons: | ||||||||||||
| potato | 1,2 | 6,4 | 1,9 | 2,2 | 1,0 | 0,9 | 0,5 | 0,7 | 1,0 | 1,0 | 1,0 | 1,0 |
| vegetables | 1,0 | 1,1 | 0,4 | 0,4 | 0,3 | 0,1 | 0,1 | 0,1 | 0,2 | 0,1 | 0,1 | 0,1 |
| livestock and poultry for slaughter (in slaughter weight) | 6,0 | 4,1 | 3,2 | 2,9 | 2,8 | 2,7 | 3,0 | 3,4 | 4,0 | 4,4 | 4,5 | 4,9 |
| milk | 8,7 | 5,3 | 2,8 | 2,5 | 2,3 | 1,8 | 1,5 | 1,6 | 1,7 | 1,8 | 1,9 | 1,9 |
| eggs, million pcs. | 10,5 | 0,8 | 0,3 | 0,3 | 0,1 | 0,1 | 0,1 | 0,1 | 0,1 | 0,1 | 0,1 | 0,2 |
| CONSTRUCTION | ||||||||||||
| Number of operating construction organizations | 1066 | 1341 | 955 | 945 | 769 | 698 | 614 | 681 | 933 | 1245 | 1622 | |
| Volume of work performed for the type of activity “Construction” (in actual prices), million rubles. | 21265,7 | 78349,1 | 76176,3 | 61704,6 | 63740,5 | 105093,9 | 174684,0 | 175915,0 | 179857,3 | 151588,8 | ||
| Index of physical volume of work performed by type of activity “Construction”, as a percentage of the previous year | 77,8 | 88,1 | 142,4 | 137,7 | 104,0 | 88,4 | 75,5 | |||||
| Commissioning of residential buildings, thousand m2 of total area | 477 | 194 | 97 | 127 | 151 | 183 | 251 | 254 | 230 | 135 | 140 | 168 |
| Share of residential buildings built by the population using their own and borrowed funds in the total housing commissioning, percent | 0,3 | 1,2 | 6,7 | 8,7 | 11,8 | 9,3 | 12,4 | 17,7 | 13,5 | 19,9 | 17,5 | 19,5 |
| Commissioning of social and cultural facilities: | ||||||||||||
| preschool institutions, places | 2565 | — | 60 | 140 | — | 50 | 370 | — | — | 80 | 400 | — |
| educational institutions, student places | 4582 | 200 | 4634 | 155 | 1455 | 2870 | 1110 | 1395 | 1885 | 3330 | 1280 | — |
| hospital facilities, beds | 60 | — | 255 | 20 | 165 | 320 | 190 | — | 67 | 94 | — | 40 |
| outpatient clinics, visits per shift | 100 | 176 | 24 | 5 | — | 205 | — | 184 | — | 150 | — | 166 |
| TRANSPORT AND COMMUNICATION | ||||||||||||
| Operating length of public railway tracks (at the end of the year), km | 498 | 495 | 496 | 496 | 496 | 496 | 496 | 481 | 481 | 481 | 481 | |
| Length of public roads with hard surface (at the end of the year), km | 59 | 358 | 830 | 960 | 954 | 1050 | 1100 | 1117 | 1259 | 1336 | 1348 | 1363 |
| Freight turnover of road transport of organizations of all types of economic activity, million tch km | 2263 | 913 | 1008 | 1718 | 1668 | 1206 | 1508 | 1472 | 1761 | 2630 | 2122 | 2334 |
| Passenger turnover of public bus transport, million passenger-kilometers | 377 | 1045 | 391 | 343 | 330 | 738 | 687 | 714 | 768 | 655 | 646 | 796 |
| Availability of residential telephone sets of the public network per 1000 people2) (at the end of the year), pcs.: | ||||||||||||
| urban | 57,7 | 113,0 | 225,4 | 271,9 | 278,3 | 285,6 | 283,0 | 281,3 | 279,5 | 267,9 | 249,0 | 223,7 |
| rural | 41,4 | 46,2 | 56,4 | 79,3 | 98,6 | 118,7 | 134,4 | 145,0 | 145,1 | 142,3 | 140,5 | 134,9 |
| TRADE AND SERVICES TO THE PUBLIC | ||||||||||||
| Retail trade turnover (in actual prices): | ||||||||||||
| total, million rubles (1990, 1995 - billion rubles) | 1,2 | 3498 | 12999 | 27021 | 34896 | 47788 | 61973 | 78194 | 100302 | 88527 | 82511 | 87450 |
| per capita2), rub. (1990, 1995 - thousand rubles) | 2,4 | 7251 | 26138 | 53012 | 68062 | 92616 | 119293 | 149563 | 191602 | 169088 | 157304 | 164770 |
| Index of physical volume of retail trade turnover, as a percentage of the previous year | 122,1 | 94,8 | 102,3 | 115,9 | 119,9 | 120,0 | 113,5 | 117,4 | 118,9 | 81,1 | 88,6 | 101,5 |
| Public catering turnover (in actual prices), million rubles. (1990, 1995 - billion rubles) | 0,1 | 166 | 1118 | 2802 | 3981 | 5826 | 9189 | 12535 | 15649 | 10630 | 11608 | 11364 |
| Index of physical volume of public catering turnover, as a percentage of the previous year | 105,4 | 54,0 | 107,3 | 105,0 | 122,7 | 113,9 | 133,9 | 126,8 | 118,5 | 65,4 | 97,0 | 93,4 |
| Volume of paid services to the population (in actual prices), million rubles. (1990, 1995 - billion rubles) | 0,2 | 870 | 2861 | 8882 | 11039 | 14001 | 16775 | 20459 | 24643 | 27816 | 29929 | 31174 |
| Index of physical volume of paid services to the population, as a percentage of the previous year | 110,4 | …5) | 114,4 | 103,9 | 106,6 | 103,9 | 105,0 | 114,2 | 105,5 | 102,9 | 101,3 | 102,5 |
| FINANCE | ||||||||||||
| Revenues of the consolidated budget of the subject, million rubles. (1995 - billion rubles) | 3523 | 29564 | 49767 | 53802 | 58887 | 64617 | 70971 | 88967 | 88833 | 106813 | 136859 | |
| of which municipal revenues | 32280 | 36272 | 36842 | 51714 | 63788 | 68805 | 62125 | 73114 | 95216 | |||
| Expenses of the consolidated budget of the subject, million rubles. (1995 - billion rubles) | 3646 | 29949 | 49738 | 51343 | 52172 | 64270 | 71706 | 81317 | 76694 | 95610 | 145642 | |
| of which expenses of municipalities | 31089 | 36460 | 37421 | 50948 | 61373 | 67771 | 61250 | 70447 | 91854 | |||
| Receipt of taxes, fees and other obligatory payments into the budget system of the Russian Federation, million rubles. (1995 - billion rubles) | 8112 | 34599 | 118955 | 184567 | 276940 | 300989 | 288386 | 337690 | 264478 | 327395 | 453723 | |
| Debt on taxes and fees to the budget system of the Russian Federation, million rubles. (1995 - billion rubles) | 2585 | 13305 | 8358 | 7054 | 7076 | 4996 | 6324 | 5917 | 6111 | 4331 | 4716 | |
| INVESTMENTS | ||||||||||||
| Investments in fixed assets (in actual prices), million rubles. (1990, 1995 - billion rubles) | 8,7 | 13048 | 82458 | 165420 | 164647 | 141234 | 170738 | 287954 | 399611 | 344336 | 387696 | 469227 |
| Index of physical volume of investments in fixed assets, as a percentage of the previous year | 110,0 | 160,4 | 107,0 | 88,4 | 80,0 | 104,8 | 143,9 | 117,2 | 89,2 | 99,8 | 110,7 | |
| Share of investments in fixed assets financed from budgetary funds in the total volume of investments, percent | 5,9 | 8,4 | 7,1 | 8,3 | 9,7 | 9,4 | 5,3 | 3,5 | 4,2 | 3,3 | 5,6 | |
| including at the expense of the federal budget | 1,3 | 1,9 | 0,1 | 0,01 | 0,1 | 0,1 | 0,05 | 0,1 | 0,2 | 0,05 | 0,1 | |
| PRICES | ||||||||||||
| Consumer price index (December compared to December of the previous year), percent | 118,7 | 109,3 | 112,2 | 117,9 | 109,9 | 109,3 | 110,6 | 107,7 | 108,2 | 103,1 | ||
| Cost of a fixed set of consumer goods and services (at the end of the year): | ||||||||||||
| rub. | 3291,1 | 5444,9 | 6180,9 | 7195,0 | 8017,5 | 8924,1 | 10561,3 | 11892,6 | 12684,3 | 13231,6 | ||
| as a percentage of the average Russian cost | 146 | 152 | 151 | 153 | 153 | 147 | 151 | 154 | 146 | 144 | ||
| * * * * * 1) For 2003-2009. the data has been recalculated taking into account the results of the 2010 All-Russian Population Census. 2) For 2003-2010. indicators were calculated using the population recalculated taking into account the results of the 2010 All-Russian Population Census. 3) For commercial organizations (without small businesses). 4) Aggregated production index by type of economic activity “Mining”, “Manufacturing”, “Production and distribution of electricity, gas and water”. The dynamics of industrial production for 2010 were clarified in accordance with the Regulations for the development and publication of data on the products of mining and manufacturing industries, production and distribution of electricity, gas and water, approved by Rosstat and the Ministry of Economic Development of Russia on June 25, 2009. 5) The indicator for autonomous okrugs was not calculated in 1995. | ||||||||||||
Regions of Russia. Main characteristics of the constituent entities of the Russian Federation - 2012. Copyright © Federal State Statistics Service
Gubkinsky
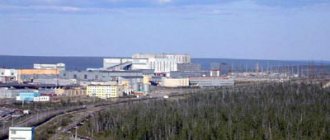
The city of Gubkinsky (Yamalo-Nenets Autonomous Okrug) became a city of district significance in 1996 and was named after the Soviet geologist Ivan Mikhailovich Gubkin. It is located on the left bank of the Pyakupur River, two hundred kilometers from the Arctic Circle. This city was formed as a base center for the development of oil deposits. Therefore, Gubkinsky (Yamalo-Nenets Autonomous Okrug) mainly specializes in the oil and gas production and processing industries. The city does a good job of working with young people: there are sports and cultural centers, a dance school, and a recording studio. Young people have the opportunity to get an education in their hometown.
Interesting facts about the climate of the peninsula
The local climate greatly affects your health. Of course, the northern people have their own diseases, such as frostbite in the upper part of the lungs.
Scientists have identified one very interesting point that is directly related to the north. All people who have lived on the Yamal Peninsula for more than seven years have dilated heart arteries. This change affects the psychosomatic state of the individual, as a result of which the person becomes more hospitable, kinder, more responsive and affectionate. In such difficult conditions it is impossible to survive by remaining a wolf, so there is nothing surprising in the changes.
Noyabrsk. Yamalo-Nenets Autonomous Okrug
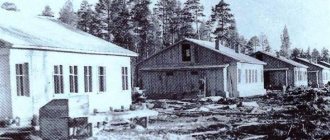
After Novy Urengoy, Noyabrsk is the second most populous city in the Yamal-Nenets Autonomous Okrug. The founding date of the city can be considered 1973, when the first oil well was drilled on the site of present-day Noyabrsk. Two years later, the first settlers arrived here, who mainly consisted of workers. Back in 1976, the village of Noyabrsk could only be found on oil workers’ maps, and already in 1982 the village was given the status of a district town. The oil and gas and fuel industries are very well developed. More than thirty companies operate in this field.
Geographical features
The Yamal Peninsula on the map of Russia is located at a distance of 800 km from the Arctic Circle.
In ancient times, there was an endless glacier across the entire area of the peninsula, but over time, the climate made its own adjustments to the relief of Yamal. In place of the deep sea, there is currently a flat area.
The relief of the mainland throughout the entire territory is flat, with a height difference not exceeding 90 m. The average height of the peninsula is approximately 50 m. A special feature of the terrain is heavy swampiness and multiple karst lakes.
The base of the Yamal platform is an epi-Paleozoic layer with a Meso-Cenozoic cover, on which there are no protrusions of crystals in the form of a foundation.
The main natural gas deposits are located on the western and southern coasts of the continent, the largest among them:
- Kharasaveyskoe;
- Bovanenkovskoe;
- South Tambeyskoe.
The landscape of the peninsula is represented by tundra and forest-tundra parts, where permafrost and small thawed soils can be observed exclusively under high-water reservoirs.
Soil layers of the peninsula:
- Podburs;
- Gleyzems;
- Peat.
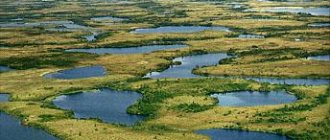
The district's water resources are diverse and feature a large supply of surface and underground water bodies. Throughout the entire territory of the Yamalo-Nenets Okrug there are almost 300 thousand lakes and 48 thousand rivers. On the northern side, sea plains adjoin the Kara coast and its bays. In a later period, multi-stage terraces and heaving mounds emerged from under the water, which contributed to the formation of small reservoirs. On the southern side of the district there are moraine and fluvio-glacial plains, the topography of which is similar to the Quaternary glaciation of the territory.
The Yamal Peninsula on the map of Russia is represented by the largest bodies of water:
- Pelvis;
- Ob;
- Pur;
- Nadym.
The Kara coastline is heavily indented along almost its entire length. The seashore is flat, the water near the coast is slightly salty. The total area of the Kara Bay is 44 square meters. km, which allows the reservoir to have the status of the largest bay in the entire northern part of the country. Due to sand deposits brought by rivers, the Ob Bay is gradually becoming smaller.
The largest number of rivers can be classified as flat type with a slow flow, wide floodplains and a huge number of channel lakes and channels. More than 200 rivers in the district have a length of more than 100 km. Rivers are recharged with water mainly due to snow and rainfall, as well as due to recharge from marsh and groundwater.
Due to a combination of factors, river floods occur in June and last for about 2 months. In October, ice begins to freeze on the rivers and shallow reservoirs freeze to the very bottom. From the beginning of the May days, ice drift begins, which can last until the beginning of June.
The largest number of lakes in Yamal are of glacial origin, less common are:
- floodplain;
- thermokarst;
- coastal-lagoonal;
- western ones.
The swamps in Yamal have predominantly flat-hilly and polygonal structures. On the territory of Yamal there are huge reserves of thermal and artesian waters. The area of the artesian basin in the West Siberian Lowland is approximately 3 million square meters. km. It is fed by surface waters that flow from the mountains.