Healthcare
One of the important areas of the region is healthcare. The authorities spend huge amounts of money on the expansion and development of this structure, since many people suffer from one or another ailment.
In the Ryazan region, according to data available for 2022, the following are registered annually:
- 269 patients diagnosed with HIV infection;
- 5354 patients diagnosed with malignant neoplasm, i.e. suffering from various cancers. This category of the population receives modern and effective treatment in the best clinics in the region;
- 367 patients with tuberculosis disease;
- 131 patients being treated for drug addiction;
- 1354 people with alcoholism;
- 73 patients diagnosed with syphilis.
The Ryazan region is pursuing an active policy aimed at increasing the population, and therefore actively supports socially important institutions of childhood and motherhood. As of 2022, 4,701 cases of termination of pregnancy were registered in the region. This figure is decreasing every year.
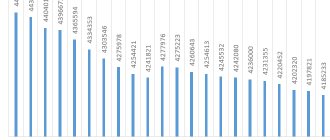
Population dynamics[ | ]
| Population | ||||||||
| 1897[2] | 1926[3] | 1928[4] | 1959[5] | 1970[6] | 1979[7] | 1987[8] | 1989[9] | 1990[10] |
| 1 802 196 | ↗2 428 914 | ↗2 461 600 | ↘1 444 755 | ↘1 411 590 | ↘1 361 839 | ↘1 312 000 | ↗1 345 924 | ↗1 350 263 |
| 1991[10] | 1992[10] | 1993[10] | 1994[10] | 1995[10] | 1996[10] | 1997[10] | 1998[10] | 1999[10] |
| ↗1 350 283 | ↘1 344 383 | ↘1 341 302 | ↘1 335 735 | ↘1 330 682 | ↘1 321 534 | ↘1 311 627 | ↘1 300 005 | ↘1 288 562 |
| 2000[10] | 2001[10] | 2002[11] | 2003[10] | 2004[10] | 2005[10] | 2006[10] | 2007[10] | 2008[10] |
| ↘1 274 503 | ↘1 258 828 | ↘1 227 910 | ↘1 223 738 | ↘1 208 169 | ↘1 194 753 | ↘1 182 011 | ↘1 172 325 | ↘1 164 530 |
| 2009[10] | 2010[12] | 2011[10] | 2012[13] | 2013[14] | 2014[15] | 2015[16] | 2016[17] | 2017[18] |
| ↘1 157 740 | ↘1 154 114 | ↘1 151 838 | ↘1 148 457 | ↘1 144 650 | ↘1 140 844 | ↘1 135 438 | ↘1 130 103 | ↘1 126 739 |
| 2018[19] | 2019[20] | 2020[1] | 2021[21] | 2022[22] | ||||
| ↘1 121 474 | ↘1 114 137 | ↘1 108 847 | ↘1 098 257 | ↘1 083 834 | ||||
| Fertility (number of births per 1000 population) | ||||||||
| 1970[23] | 1975[23] | 1980[23] | 1985[23] | 1990[23] | 1995[23] | 1996[23] | 1997[23] | 1998[23] |
| 12,4 | ↘12,1 | ↗12,6 | ↗12,8 | ↘11,6 | ↘7,8 | ↘7,5 | ↘7,1 | ↗7,3 |
| 1999[23] | 2000[23] | 2001[23] | 2002[23] | 2003[24] | 2004[24] | 2005[24] | 2006[24] | 2007[25] |
| ↘7 | →7 | ↗7,3 | ↗7,7 | ↗8,3 | ↗8,5 | ↘8,4 | ↗8,5 | ↗9,4 |
| 2008[25] | 2009[25] | 2010[25] | 2011[26] | 2012[27] | 2013[28] | 2014[29] | ||
| ↗10,1 | →10,1 | ↗10,2 | ↗10,3 | ↗10,8 | →10,8 | ↗11 | ||
| Mortality rate (number of deaths per 1000 population) | ||||||||
| 1970[30] | 1975[30] | 1980[30] | 1985[30] | 1990[30] | 1995[30] | 1996[30] | 1997[30] | 1998[30] |
| 9,9 | ↗11,3 | ↗13 | ↗13,8 | ↗14 | ↗17,9 | ↘17,4 | →17,4 | ↘17,1 |
| 1999[30] | 2000[30] | 2001[30] | 2002[30] | 2003[31] | 2004[31] | 2005[31] | 2006[31] | 2007[32] |
| ↗18,6 | ↗19,1 | ↗19,7 | ↗20,3 | ↗21,2 | ↘20,2 | ↗20,3 | ↘19,2 | ↘19 |
| 2008[32] | 2009[32] | 2010[32] | 2011[33] | 2012[34] | 2013[35] | 2014[36] | ||
| ↘18,6 | ↘17,8 | ↗18,1 | ↘16,5 | ↘16,3 | ↘15,8 | ↗16,1 | ||
| Natural population growth (per 1000 population, sign (-) means natural population decline) | ||||||||
| 1970[37] | 1975[38] | 1980[39] | 1985[40] | 1990[41] | 1995[42] | 1996[43] | 1997[44] | 1998[45] |
| 2,5 | ↘0,8 | ↘−0,4 | ↘−1 | ↘−2,4 | ↘−10,1 | ↗−9,9 | ↘−10,3 | ↗−9,8 |
| 1999[46] | 2000[47] | 2001[48] | 2002[49] | 2003[50] | 2004[50] | 2005[50] | 2006[50] | 2007[51] |
| ↘−11,6 | ↘−12,1 | ↘−12,4 | ↘−12,6 | ↘−12,9 | ↗−11,7 | ↘−11,9 | ↗−10,7 | ↗−9,6 |
| 2008[51] | 2009[51] | 2010[51] | 2011[52] | 2012[53] | 2013[54] | 2014[55] | ||
| ↗−8,5 | ↗−7,7 | ↘−7,9 | ↗−6,2 | ↗−5,5 | ↗−5 | ↘−5,1 | ||
| Life expectancy at birth (number of years) | ||||||||
| 1990[56] | 1991[56] | 1992[56] | 1993[56] | 1994[56] | 1995[56] | 1996[56] | 1997[56] | 1998[56] |
| 69,3 | ↘69,2 | ↘68,5 | ↘65,9 | ↘64,1 | ↗64,9 | ↗65,8 | ↗66,3 | ↗66,8 |
| 1999[56] | 2000[56] | 2001[56] | 2002[56] | 2003[56] | 2004[56] | 2005[56] | 2006[56] | 2007[56] |
| ↘65,4 | ↘64,9 | ↘64,5 | ↘64,1 | ↘63,4 | ↗64,1 | ↘64 | ↗65,2 | ↗65,6 |
| 2008[56] | 2009[56] | 2010[56] | 2011[57] | 2012[57] | 2013[57] | |||
| ↗66,4 | ↗67,7 | ↗67,8 | ↗69,3 | ↗69,9 | ↗70,7 | |||
According to the All-Union and All-Russian censuses[58][59]:
| year | 1959 | 1970 | 1979 | 1989 | 2002 | 2010 |
| total population, people | 1 444 755 | ↘1 411 590 | ↘1 361 839 | ↘1 345 924 | ↘1 227 910 | ↘1 154 114 |
| urban population, people | 437 409 | ↗ 664 750 | ↗ 793 958 | ↗ 884 900 | ↘ 846 180 | ↘ 818 349 |
| urban population, % | 30,3 | ↗ 47,1 | ↗ 58,3 | ↗ 65,7 | ↗ 68,9 | ↗ 70,9 |
Ratio of men and women (data from Rosstat[60])
| Year | Number of women per 1000 men |
| 2005 | 1199 |
| 2010 | 1200 |
| 2011 | 1199 |
| 2012 | 1197 |
| 2013 | 1196 |
| 2014 | 1196 |
| 2015 | 1195 |
| 2016 | 1193 |
| 2017 | 1191 |
Subjects of the Russian Federation by population statistics (Table)
The reference tables “Constituents of the Russian Federation by population” contain statistical data on the population of constituent entities of the Russian Federation and federal districts in 2022, 2022 and 2010, broken down by the entire population, urban and rural population of Russia.
Subjects of the Russian Federation by population for 2022 and 2022 table
This table presents the constituent entities of the Russian Federation and their population for 2022 and 2022, broken down into urban and rural populations.
The largest subject of the Russian Federation in terms of population is the city of Moscow (126,924.7 thousand people)
The smallest subject of the Russian Federation in terms of population is the Nenets Autonomous Okrug (441.1 thousand people)
| Subjects of the Russian Federation | As of January 1, 2022 | Average for 2022 | ||||
| Whole population | Urban population | Rural population | Whole population | Urban population | Rural population | |
| Russian Federation | 146745,1 | 109548,44 | 37196,66 | 146762,91 | 109500,99 | 37261,92 |
| Central Federal District | 39439,49 | 32446,53 | 6992,96 | 39408,78 | 32421,21 | 6987,56 |
| Belgorod region | 1547,53 | 1044,62 | 502,91 | 1547,48 | 1044,21 | 503,27 |
| Bryansk region | 1192,57 | 839,96 | 352,61 | 1196,38 | 842,56 | 353,82 |
| Vladimir region | 1358,54 | 1063,14 | 295,39 | 1362,17 | 1065,99 | 296,18 |
| Voronezh region | 2323,66 | 1578,55 | 745,11 | 2325,74 | 1578,58 | 747,16 |
| Ivanovo region | 997,2 | 814,76 | 182,43 | 1000,69 | 817,11 | 183,58 |
| Kaluga region | 1000,07 | 758,62 | 241,45 | 1004,73 | 762,69 | 242,03 |
| Kostroma region | 633,39 | 460,49 | 172,9 | 635,33 | 461,01 | 174,32 |
| Kursk region | 1103,06 | 755,46 | 347,6 | 1105,05 | 755,19 | 349,86 |
| Lipetsk region | 1139,49 | 736,62 | 402,87 | 1141,76 | 737,45 | 404,32 |
| Moscow region | 7687,65 | 6255,44 | 1432,21 | 7643,65 | 6223,41 | 1420,24 |
| Oryol Region | 733,68 | 490,12 | 243,57 | 736,58 | 491,99 | 244,58 |
| Ryazan Oblast | 1108,92 | 800,8 | 308,12 | 1111,53 | 802,25 | 309,28 |
| Smolensk region | 934,75 | 671,45 | 263,3 | 938,56 | 674,23 | 264,32 |
| Tambov Region | 1006,96 | 618,17 | 388,79 | 1011,46 | 619,58 | 391,89 |
| Tver region | 1260,35 | 959,75 | 300,59 | 1264,99 | 962,29 | 302,7 |
| Tula region | 1466,03 | 1096,89 | 369,13 | 1472,42 | 1101,7 | 370,72 |
| Yaroslavl region | 1253,19 | 1022,43 | 230,76 | 1256,4 | 1025,08 | 231,32 |
| Moscow | 12692,47 | 12479,25 | 213,22 | 12653,87 | 12455,89 | 197,98 |
| Northwestern Federal District | 13977,27 | 11869,53 | 2107,74 | 13974,67 | 11839,67 | 2135,01 |
| Republic of Karelia | 614,63 | 498,16 | 116,47 | 616,34 | 498,49 | 117,85 |
| Komi Republic | 820,17 | 641,44 | 178,73 | 825,2 | 645,45 | 179,76 |
| Arhangelsk region | 1136,39 | 893,31 | 243,08 | 1140,25 | 894,69 | 245,57 |
| Nenets Autonomous Okrug | 44,11 | 32,54 | 11,57 | 43,97 | 32,33 | 11,64 |
| Arkhangelsk region without Nenets Autonomous Okrug | 1092,28 | 860,76 | 231,51 | 1096,28 | 862,36 | 233,92 |
| Vologda Region | 1160,72 | 843,53 | 317,19 | 1164,22 | 845,6 | 318,62 |
| Kaliningrad region | 1012,25 | 786,07 | 226,18 | 1007,22 | 782,56 | 224,66 |
| Leningrad region | 1876,39 | 1259,05 | 617,35 | 1862,13 | 1223,95 | 638,18 |
| Murmansk region | 741,51 | 683,46 | 58,05 | 744,78 | 686,72 | 58,07 |
| Novgorod region | 596,17 | 426,22 | 169,95 | 598,24 | 427,23 | 171,01 |
| Pskov region | 626,05 | 445,3 | 180,75 | 627,85 | 446,54 | 181,31 |
| Saint Petersburg | 5392,99 | 5392,99 | 0 | 5388,44 | 5388,44 | 0 |
| Southern Federal District | 16466,17 | 10337,28 | 6128,9 | 16460,36 | 10327 | 6133,36 |
| Republic of Adygea | 463,45 | 219,14 | 244,32 | 459,1 | 216,64 | 242,46 |
| Republic of Kalmykia | 271,04 | 124,39 | 146,64 | 271,84 | 124,31 | 147,53 |
| Republic of Crimea | 1912,03 | 974,74 | 937,29 | 1911,92 | 974,81 | 937,11 |
| Krasnodar region | 5677,79 | 3142,39 | 2535,39 | 5663,01 | 3129,42 | 2533,59 |
| Astrakhan region | 1005,97 | 671,31 | 334,66 | 1010,02 | 674,19 | 335,83 |
| Volgograd region | 2491,75 | 1925,88 | 565,87 | 2499,63 | 1929,81 | 569,82 |
| Rostov region | 4195,33 | 2860,93 | 1334,4 | 4198,82 | 2862,3 | 1336,53 |
| Sevastopol | 448,83 | 418,49 | 30,34 | 446,02 | 415,53 | 30,5 |
| North Caucasus Federal District | 9928,72 | 4991,95 | 4936,77 | 9897,73 | 4969,56 | 4928,17 |
| The Republic of Dagestan | 3111,35 | 1409,38 | 1701,97 | 3098,74 | 1403,05 | 1695,69 |
| The Republic of Ingushetia | 506,69 | 281,97 | 224,72 | 502,04 | 278,93 | 223,11 |
| Kabardino-Balkarian Republic | 868,17 | 451,83 | 416,34 | 867,2 | 451,42 | 415,78 |
| Karachay-Cherkess Republic | 465,67 | 199,7 | 265,97 | 465,62 | 199,58 | 266,03 |
| Republic of North Ossetia-Alania | 697,06 | 448,32 | 248,74 | 698,16 | 449,1 | 249,06 |
| Chechen Republic | 1476,75 | 544,76 | 931,99 | 1466,85 | 539,82 | 927,03 |
| Stavropol region | 2803,02 | 1655,99 | 1147,03 | 2799,13 | 1647,67 | 1151,47 |
| Volga Federal District | 29286,45 | 21141,68 | 8144,77 | 29341,83 | 21162,57 | 8179,26 |
| Republic of Bashkortostan | 4037,81 | 2520,97 | 1516,84 | 4044,41 | 2520,92 | 1523,49 |
| Mari El Republic | 679,09 | 455,18 | 223,92 | 679,74 | 454,3 | 225,44 |
| The Republic of Mordovia | 790,83 | 504,91 | 285,92 | 793,17 | 504,58 | 288,58 |
| Republic of Tatarstan | 3902,64 | 3001,69 | 900,95 | 3900,64 | 3000,08 | 900,55 |
| Udmurt republic | 1501,01 | 992,33 | 508,68 | 1504,2 | 993,35 | 510,85 |
| Chuvash Republic | 1217,82 | 772,1 | 445,72 | 1220,61 | 771,38 | 449,23 |
| Perm region | 2599,3 | 1973,09 | 626,22 | 2605,05 | 1976,94 | 628,11 |
| Kirov region | 1262,55 | 982,01 | 280,54 | 1267,33 | 982,66 | 284,67 |
| Nizhny Novgorod Region | 3203,82 | 2553,18 | 650,64 | 3209,22 | 2555,44 | 653,78 |
| Orenburg region | 1956,26 | 1186,26 | 770 | 1959,63 | 1184,89 | 774,74 |
| Penza region | 1304,83 | 899,24 | 405,59 | 1311,46 | 902,31 | 409,15 |
| Samara Region | 3179,03 | 2537,27 | 641,76 | 3181,03 | 2539,34 | 641,69 |
| Saratov region | 2421,79 | 1830,96 | 590,83 | 2431,3 | 1841,94 | 589,36 |
| Ulyanovsk region | 1229,69 | 932,51 | 297,18 | 1234,05 | 934,45 | 299,61 |
| Ural federal district | 12360,54 | 10086,79 | 2273,75 | 12355,33 | 10078,44 | 2276,89 |
| Kurgan region | 826,94 | 514,37 | 312,57 | 830,82 | 516,44 | 314,38 |
| Sverdlovsk region | 4310,86 | 3664,83 | 646,03 | 4313,28 | 3665,43 | 647,85 |
| Tyumen region | 3755,78 | 3042,59 | 713,19 | 3739,87 | 3026,59 | 713,29 |
| Khanty-Mansiysk Autonomous Okrug-Yugra | 1674,09 | 1548,53 | 125,56 | 1668,94 | 1543,28 | 125,66 |
| Yamalo-Nenets Autonomous Okrug | 544,01 | 456,6 | 87,4 | 542,74 | 455,43 | 87,31 |
| Tyumen region without autonomous okrugs | 1537,68 | 1037,46 | 500,22 | 1528,19 | 1027,88 | 500,32 |
| Chelyabinsk region | 3466,96 | 2865 | 601,96 | 3471,36 | 2869,99 | 601,37 |
| Siberian Federal District | 17119,09 | 12715,42 | 4403,68 | 17146,21 | 12737,93 | 4408,29 |
| Altai Republic | 220,14 | 64,48 | 155,66 | 219,5 | 64,16 | 155,34 |
| Tyva Republic | 327,39 | 177,67 | 149,72 | 325,91 | 176,56 | 149,34 |
| The Republic of Khakassia | 534,19 | 372,96 | 161,23 | 535,18 | 373,25 | 161,92 |
| Altai region | 2317,05 | 1320,07 | 996,99 | 2324,93 | 1321,34 | 1003,59 |
| Krasnoyarsk region | 2867,88 | 2223,28 | 644,59 | 2870,95 | 2226,13 | 644,82 |
| Irkutsk region | 2390,83 | 1866,87 | 523,96 | 2394,3 | 1877,45 | 516,85 |
| Kemerovo region | 2657,76 | 2287,21 | 370,55 | 2666,01 | 2294,06 | 371,95 |
| Novosibirsk region | 2798,25 | 2216,51 | 581,74 | 2795,82 | 2213,34 | 582,48 |
| Omsk region | 1926,56 | 1405,12 | 521,44 | 1935,38 | 1410,38 | 524,99 |
| Tomsk region | 1079,05 | 781,26 | 297,79 | 1078,25 | 781,25 | 297 |
| Far Eastern Federal District | 8167,36 | 5959,27 | 2208,09 | 8177,99 | 5964,6 | 2213,39 |
| The Republic of Buryatia | 986,11 | 584,18 | 401,93 | 984,69 | 582,47 | 402,23 |
| The Republic of Sakha (Yakutia) | 970,11 | 640,9 | 329,21 | 968,56 | 639,17 | 329,38 |
| Transbaikal region | 1059,66 | 722,66 | 337 | 1062,72 | 725,95 | 336,77 |
| Kamchatka Krai | 312,44 | 245,13 | 67,31 | 313,58 | 245,95 | 67,64 |
| Primorsky Krai | 1895,31 | 1468,92 | 426,39 | 1899,01 | 1470,68 | 428,33 |
| Khabarovsk region | 1315,31 | 1079,73 | 235,58 | 1318,39 | 1081,98 | 236,41 |
| Amur region | 790,68 | 535,76 | 254,92 | 791,94 | 535,67 | 256,27 |
| Magadan Region | 140,2 | 134,72 | 5,48 | 140,72 | 135,21 | 5,51 |
| Sakhalin region | 488,45 | 402,27 | 86,18 | 489,05 | 402,4 | 86,65 |
| Jewish Autonomous Region | 158,38 | 108,74 | 49,64 | 159,15 | 109,4 | 49,75 |
| Chukotka Autonomous Okrug | 50,73 | 36,27 | 14,45 | 50,2 | 35,73 | 14,46 |
Subjects of the Russian Federation by population in 2010 table
The population of the constituent entities of the Russian Federation for 2010 was compiled based on the results of the 2010 All-Russian Population Census on Population.
| Subject of the Russian Federation | Resident population, thousand people | 2010 as a percentage of 2002 (total population) | In the total permanent population, percent | |||||
| the entire population | including | 2010 | 2002 | |||||
| urban population | rural population | urban population | rural population | urban population | rural population | |||
| Russian Federation | 142905,2 | 105318 | 37587,2 | 98,4 | 73,7 | 26,3 | 73,3 | 26,7 |
| Central Federal District | 38438,6 | 31261,6 | 7177 | 101,2 | 81,3 | 18,7 | 79,9 | 20,1 |
| Belgorod region | 1532,7 | 1013,1 | 519,6 | 101,4 | 66,1 | 33,9 | 65,2 | 34,8 |
| Bryansk region | 1278,1 | 883,3 | 394,8 | 92,7 | 69,1 | 30,9 | 68,4 | 31,6 |
| Vladimir region | 1444,6 | 1121,4 | 323,2 | 94,8 | 77,6 | 22,4 | 79,7 | 20,3 |
| Voronezh region | 2335,8 | 1487 | 848,8 | 98,2 | 63,7 | 36,3 | 61,9 | 38,1 |
| Ivanovo region | 1062,6 | 860,3 | 202,3 | 92,5 | 81 | 19 | 82,7 | 17,3 |
| Kaluga region | 1011,6 | 772,3 | 239,3 | 97,1 | 76,3 | 23,7 | 74,8 | 25,2 |
| Kostroma region | 667,5 | 466,2 | 201,3 | 90,6 | 69,8 | 30,2 | 67,4 | 32,6 |
| Kursk region | 1126,5 | 734,1 | 392,4 | 91,2 | 65,2 | 34,8 | 61,2 | 38,8 |
| Lipetsk region | 1172,8 | 746,5 | 426,3 | 96,6 | 63,7 | 36,3 | 64,3 | 35,7 |
| Moscow region | 7092,9 | 5680,9 | 1412 | 107,2 | 80,1 | 19,9 | 79,3 | 20,7 |
| Oryol Region | 787,2 | 515,6 | 271,6 | 91,5 | 65,5 | 34,5 | 63,5 | 36,5 |
| Ryazan Oblast | 1154,2 | 818,4 | 335,8 | 94 | 70,9 | 29,1 | 68,9 | 31,1 |
| Smolensk region | 985,5 | 716,3 | 269,2 | 93,9 | 72,7 | 27,3 | 70,8 | 29,2 |
| Tambov Region | 1092,4 | 641,1 | 451,3 | 92,7 | 58,7 | 41,3 | 57,2 | 42,8 |
| Tver region | 1353,5 | 1011,6 | 341,9 | 92 | 74,7 | 25,3 | 73,1 | 26,9 |
| Tula region | 1553,9 | 1233,7 | 320,2 | 92,7 | 79,4 | 20,6 | 81,6 | 18,4 |
| Yaroslavl region | 1272,5 | 1045,5 | 227 | 93,1 | 82,2 | 17,8 | 80,9 | 19,1 |
| Moscow | 11514,3 | 11514,3 | — | 110,9 | 100 | — | 100 | — |
| Northwestern Federal District | 13583,8 | 11342,9 | 2240,9 | 97,2 | 83,5 | 16,5 | 82,3 | 17,7 |
| Republic of Karelia | 645,2 | 503,9 | 141,3 | 90,1 | 78,1 | 21,9 | 75 | 25 |
| Komi Republic | 901,6 | 693,9 | 207,7 | 88,5 | 77 | 23 | 75,3 | 24,7 |
| Arkhangelsk region including Nenets Autonomous Okrug | 1228,1 | 928,9 | 299,2 | 91,9 | 75,6 | 24,4 | 74,8 | 25,2 |
| Nenets Autonomous Okrug | 42,7 | 28,7 | 14 | 102,9 | 67,2 | 32,8 | 63,2 | 36,8 |
| Vologda Region | 1202,3 | 849,7 | 352,6 | 94,7 | 70,7 | 29,3 | 69 | 31 |
| Kaliningrad region | 941,5 | 730,3 | 211,2 | 98,6 | 77,6 | 22,4 | 77,6 | 22,4 |
| Leningrad region | 1712,7 | 1128 | 584,7 | 102,6 | 65,9 | 34,1 | 66,4 | 33,6 |
| Murmansk region | 796,1 | 739 | 57,1 | 89,2 | 92,8 | 7,2 | 92,2 | 7,8 |
| Novgorod region | 634,1 | 447,9 | 186,2 | 91,3 | 70,6 | 29,4 | 69,8 | 30,2 |
| Pskov region | 673,5 | 472,6 | 200,9 | 88,5 | 70,2 | 29,8 | 66,1 | 33,9 |
| Saint Petersburg | 4848,7 | 4848,7 | — | 104 | 100 | — | 100 | — |
| Southern Federal District | 13856,7 | 8650,9 | 5205,8 | 99,2 | 62,4 | 37,6 | 62,9 | 37,1 |
| Republic of Adygea | 440,4 | 224,7 | 215,7 | 98,5 | 51 | 49 | 52,5 | 47,5 |
| Republic of Kalmykia | 289,4 | 127,6 | 161,8 | 99 | 44,1 | 55,9 | 44,3 | 55,7 |
| Krasnodar region | 5225,8 | 2764,6 | 2461,2 | 102 | 52,9 | 47,1 | 53,5 | 46,5 |
| Astrakhan region | 1010,7 | 674 | 336,7 | 100,5 | 66,7 | 33,3 | 67,7 | 32,3 |
| Volgograd region | 2611,2 | 1984 | 627,2 | 96,7 | 76 | 24 | 75,2 | 24,8 |
| Rostov region | 4279,2 | 2876 | 1403,2 | 97,2 | 67,2 | 32,8 | 67,6 | 32,4 |
| North Caucasus Federal District | 9496,8 | 4666,7 | 4830,1 | 106,3 | 49,1 | 50,9 | 49 | 51 |
| The Republic of Dagestan | 2977,4 | 1347,5 | 1629,9 | 115,6 | 45,3 | 54,7 | 42,8 | 57,2 |
| The Republic of Ingushetia | 413 | 158 | 255 | 88,4 | 38,3 | 61,7 | 42,5 | 57,5 |
| Kabardino-Balkarian Republic | 859,8 | 468,3 | 391,5 | 95,4 | 54,5 | 45,5 | 56,6 | 43,4 |
| Karachay-Cherkess Republic | 478,5 | 202,5 | 276 | 108,9 | 42,3 | 57,7 | 44 | 56 |
| Republic of North Ossetia-Alania | 712,9 | 454,5 | 258,4 | 100,4 | 63,8 | 36,2 | 65,5 | 34,5 |
| Chechen Republic | 1269,1 | 443,6 | 825,5 | 115 | 35 | 65 | 33,8 | 66,2 |
| Stavropol region | 2786,1 | 1592,3 | 1193,8 | 101,9 | 57,2 | 42,8 | 56 | 44 |
| Volga Federal District | 29900,4 | 21179,6 | 8720,8 | 96 | 70,8 | 29,2 | 70,8 | 29,2 |
| Republic of Bashkortostan | 4072,1 | 2461,5 | 1610,6 | 99,2 | 60,4 | 39,6 | 64 | 36 |
| Mari El Republic | 696,3 | 439,5 | 256,8 | 95,6 | 63,1 | 36,9 | 63,1 | 36,9 |
| The Republic of Mordovia | 834,8 | 504,3 | 330,5 | 93,9 | 60,4 | 39,6 | 59,8 | 40,2 |
| Republic of Tatarstan | 3786,4 | 2853,6 | 932,8 | 100,2 | 75,4 | 24,6 | 73,8 | 26,2 |
| Udmurt republic | 1522,7 | 1053,5 | 469,2 | 97 | 69,2 | 30,8 | 69,7 | 30,3 |
| Chuvash Republic | 1251,6 | 735,8 | 515,8 | 95,3 | 58,8 | 41,2 | 60,6 | 39,4 |
| Perm region | 2635,8 | 1975,9 | 659,9 | 93,5 | 75 | 25 | 75,3 | 24,7 |
| Kirov region | 1341,3 | 993,2 | 348,1 | 89,2 | 74 | 26 | 71,8 | 28,2 |
| Nizhny Novgorod Region | 3310,6 | 2611,5 | 699,1 | 93,9 | 78,9 | 21,1 | 78,2 | 21,8 |
| Orenburg region | 2032,9 | 1212,3 | 820,6 | 93,3 | 59,6 | 40,4 | 57,8 | 42,2 |
| Penza region | 1386,2 | 930 | 456,2 | 95,4 | 67,1 | 32,9 | 65,1 | 34,9 |
| Samara Region | 3215,7 | 2579,7 | 636 | 99,3 | 80,2 | 19,8 | 80,6 | 19,4 |
| Saratov region | 2521,8 | 1879,4 | 642,4 | 94,5 | 74,5 | 25,5 | 73,6 | 26,4 |
| Ulyanovsk region | 1292,2 | 949,4 | 342,8 | 93,4 | 73,5 | 26,5 | 73,2 | 26,8 |
| Ural federal district | 12082,7 | 9658,2 | 2424,5 | 97,6 | 79,9 | 20,1 | 80,7 | 19,3 |
| Kurgan region | 910,9 | 548,9 | 362 | 89,3 | 60,3 | 39,7 | 56,3 | 43,7 |
| Sverdlovsk region | 4298 | 3604,5 | 693,5 | 95,8 | 83,9 | 16,1 | 87,9 | 12,1 |
| Tyumen region including autonomous okrugs | 3395,2 | 2652,8 | 742,4 | 104 | 78,1 | 21,9 | 77,4 | 22,6 |
| Khanty-Mansiysk Autonomous Okrug - Ugra | 1532 | 1401,1 | 130,9 | 106,9 | 91,5 | 8,5 | 90,9 | 9,1 |
| Yamalo-Nenets Autonomous Okrug | 522,8 | 442,9 | 79,9 | 103,1 | 84,7 | 15,3 | 83,4 | 16,6 |
| Chelyabinsk region | 3478,6 | 2852 | 626,6 | 96,5 | 82 | 18 | 81,8 | 18,2 |
| Siberian Federal District | 19254,3 | 13853,7 | 5400,6 | 96 | 72 | 28 | 71,1 | 28,9 |
| Altai Republic | 206,2 | 56,9 | 149,3 | 101,6 | 27,6 | 72,4 | 26,4 | 73,6 |
| The Republic of Buryatia | 972,7 | 567,8 | 404,9 | 99,1 | 58,4 | 41,6 | 59,6 | 40,4 |
| Tyva Republic | 307,9 | 163,4 | 144,5 | 100,8 | 53,1 | 46,9 | 51,5 | 48,5 |
| The Republic of Khakassia | 532,3 | 358,1 | 174,2 | 97,5 | 67,3 | 32,7 | 70,8 | 29,2 |
| Altai region | 2419,4 | 1323,2 | 1096,2 | 92,8 | 54,7 | 45,3 | 53,2 | 46,8 |
| Transbaikal region | 1106,6 | 729,1 | 377,5 | 95,8 | 65,9 | 34,1 | 63,9 | 36,1 |
| Krasnoyarsk region | 2828,2 | 2157,6 | 670,6 | 95,4 | 76,3 | 23,7 | 75,7 | 24,3 |
| Irkutsk region | 2428,7 | 1931,7 | 497 | 94,1 | 79,5 | 20,5 | 79,3 | 20,7 |
| Kemerovo region | 2763,4 | 2359,1 | 404,3 | 95,3 | 85,4 | 14,6 | 86,7 | 13,3 |
| Novosibirsk region | 2665,9 | 2059,9 | 606 | 99 | 77,3 | 22,7 | 75,1 | 24,9 |
| Omsk region | 1977,5 | 1413,1 | 564,4 | 95,1 | 71,5 | 28,5 | 68,7 | 31,3 |
| Tomsk region | 1045,5 | 733,8 | 311,7 | 100 | 70,2 | 29,8 | 67,7 | 32,3 |
| Far Eastern Federal District | 6291,9 | 4704,4 | 1587,5 | 94 | 74,8 | 25,2 | 75,9 | 24,1 |
| The Republic of Sakha (Yakutia) | 958,3 | 614,4 | 343,9 | 101 | 64,1 | 35,9 | 64,3 | 35,7 |
| Kamchatka region | 321,8 | 248,9 | 72,9 | 89,7 | 77,3 | 22,7 | 81,1 | 18,9 |
| Primorsky Krai | 1956,4 | 1488,8 | 467,6 | 94,5 | 76,1 | 23,9 | 78,3 | 21,7 |
| Khabarovsk region | 1344,2 | 1100 | 244,2 | 93,6 | 81,8 | 18,2 | 80,6 | 19,4 |
| Amur region | 829,2 | 553,4 | 275,8 | 91,8 | 66,7 | 33,3 | 65,8 | 34,2 |
| Magadan Region | 157 | 149,8 | 7,2 | 85,9 | 95,4 | 4,6 | 92,3 | 7,7 |
| Sakhalin region | 497,9 | 397 | 100,9 | 91,1 | 79,7 | 20,3 | 86,7 | 13,3 |
| Jewish Autonomous Region | 176,6 | 119,4 | 57,2 | 92,5 | 67,6 | 32,4 | 67,2 | 32,8 |
| Chukotka Autonomous Okrug | 50,5 | 32,7 | 17,8 | 93,9 | 64,8 | 35,2 | 66,6 | 33,4 |
| In addition, administrative-territorial units with a special status: | ||||||||
| as part of the Perm Territory: Komi-Permyak District | 116,2 | 29 | 87,2 | 85,4 | 25 | 75 | 26,3 | 73,7 |
| as part of the Trans-Baikal Territory: Aginsky Buryat District | 77,2 | 31,1 | 46,1 | 106,9 | 40,3 | 59,7 | 35,3 | 64,7 |
| as part of the Krasnoyarsk Territory | ||||||||
| Taimyr (Dolgano-Nenets) Autonomous Okrug | 34,4 | 22,8 | 11,6 | 86,4 | 66,3 | 33,7 | 66,2 | 33,8 |
| Evenki Autonomous Okrug | 16,2 | 5,5 | 10,7 | 91,5 | 34 | 66 | 33 | 67 |
| within the Irkutsk region: Ust-Ordynsky Buryat district | 125,2 | — | 125,2 | 92,5 | — | 100 | — | 100 |
| within the Kamchatka Territory: Koryak District | 18,8 | 5,3 | 13,5 | 74,6 | 28,2 | 71,8 | 25,9 | 74,1 |
_______________
A source of information:
National composition[ | ]
Settlement[ | ]
The vast majority of the population is Russian.
In the east and southeast of the region, Mordovians live in the Shatsky, Putyatinsky, Kadomsky and Sasovsky districts.
The Tatars are compactly settled in the Ermishinsky, Kasimovsky and Sasovsky districts, where there are four mosques. Tatar Cultural Center - Kasimov. There are also two Tatar folklore groups operating in the region - in the villages of Akhmatovo, Kasimovsky district, and Bastanovo, Sasovo district[61].
See also: Kasimov Tatars, Sasovo Tatars and Settlement of Tatars in Russia
Dynamics of national composition[ | ]
| 1959 [62] people | % | 1979 [63] people | % | 1989 [64] people | % | 2002 [65] people | % from everything | % of those who indicated nationality | 2010 [66][67] people | % from everything | % of those who indicated nationality | |
| Total | 1444755 | 100,00 % | 1365780 | 100,00 % | 1347754 | 100,00 % | 1227910 | 100,00 % | 1154114 | 100,00 % | ||
| Russians | 1419888 | 98,28 % | 1329988 | 97,38 % | 1295324 | 96,11 % | 1161447 | 94,59 % | 95,62 % | 1026919 | 88,98 % | 95,11 % |
| Ukrainians | 8385 | 0,58 % | 11811 | 0,86 % | 15542 | 1,15 % | 12671 | 1,03 % | 1,04 % | 8894 | 0,77 % | 0,82 % |
| Mordva | 2657 | 0,18 % | 5424 | 0,40 % | 8528 | 0,63 % | 7252 | 0,59 % | 0,60 % | 5564 | 0,48 % | 0,52 % |
| Armenians | 249 | 0,02 % | 487 | 0,04 % | 927 | 0,07 % | 4458 | 0,36 % | 0,37 % | 5549 | 0,48 % | 0,51 % |
| Tatars | 4331 | 0,30 % | 4324 | 0,32 % | 4922 | 0,37 % | 5569 | 0,45 % | 0,46 % | 4941 | 0,43 % | 0,46 % |
| Azerbaijanis | 121 | 0,01 % | 454 | 0,03 % | 1777 | 0,13 % | 2939 | 0,24 % | 0,24 % | 3652 | 0,32 % | 0,34 % |
| Uzbeks | 387 | 0,03 % | 749 | 0,06 % | 750 | 0,06 % | 0,06 % | 3278 | 0,28 % | 0,30 % | ||
| Gypsies | 847 | 0,06 % | 1711 | 0,13 % | 1597 | 0,12 % | 2165 | 0,18 % | 0,18 % | 2862 | 0,25 % | 0,27 % |
| Belarusians | 2296 | 0,16 % | 3497 | 0,26 % | 4580 | 0,34 % | 3500 | 0,29 % | 0,29 % | 2425 | 0,21 % | 0,22 % |
| Moldovans | 430 | 0,03 % | 399 | 0,03 % | 1490 | 0,11 % | 1133 | 0,09 % | 0,09 % | 1671 | 0,14 % | 0,15 % |
| Tajiks | 105 | 0,01 % | 252 | 0,02 % | 573 | 0,05 % | 0,05 % | 1612 | 0,14 % | 0,15 % | ||
| Germans | 1377 | 0,10 % | 991 | 0,07 % | 1054 | 0,08 % | 1571 | 0,13 % | 0,13 % | 1010 | 0,09 % | 0,09 % |
| Chuvash | 217 | 0,02 % | 915 | 0,07 % | 1419 | 0,11 % | 1284 | 0,10 % | 0,11 % | 890 | 0,08 % | 0,08 % |
| Lezgins | 57 | 0,00 % | 778 | 0,06 % | 738 | 0,06 % | 0,06 % | 796 | 0,07 % | 0,07 % | ||
| Koreans | 123 | 0,01 % | 174 | 0,01 % | 373 | 0,03 % | 0,03 % | 667 | 0,06 % | 0,06 % | ||
| Georgians | 204 | 0,01 % | 242 | 0,02 % | 368 | 0,03 % | 601 | 0,05 % | 0,05 % | 630 | 0,05 % | 0,06 % |
| Avars | 23 | 0,00 % | 437 | 0,03 % | 465 | 0,04 % | 0,04 % | 516 | 0,04 % | 0,05 % | ||
| Kyrgyz | 53 | 0,00 % | 519 | 0,04 % | 72 | 0,01 % | 0,01 % | 485 | 0,04 % | 0,04 % | ||
| Turks | 7 | 0,00 % | 351 | 0,03 % | 0,03 % | 478 | 0,04 % | 0,04 % | ||||
| Chechens | 68 | 0,00 % | 407 | 0,03 % | 504 | 0,04 % | 0,04 % | 453 | 0,04 % | 0,04 % | ||
| Arabs | 28 | 0,00 % | 3 | 0,00 % | 304 | 0,02 % | 0,03 % | 410 | 0,04 % | 0,04 % | ||
| Jews | 1754 | 0,12 % | 1592 | 0,12 % | 1264 | 0,09 % | 636 | 0,05 % | 0,05 % | 361 | 0,03 % | 0,03 % |
| Bashkirs | 235 | 0,02 % | 476 | 0,04 % | 386 | 0,03 % | 0,03 % | 333 | 0,03 % | 0,03 % | ||
| Kazakhs | 180 | 0,01 % | 264 | 0,02 % | 522 | 0,04 % | 294 | 0,02 % | 0,02 % | 307 | 0,03 % | 0,03 % |
| Kumyks | 20 | 0,00 % | 447 | 0,03 % | 254 | 0,02 % | 0,02 % | 269 | 0,02 % | 0,02 % | ||
| Yazidis | 137 | 0,01 % | 0,01 % | 265 | 0,02 % | 0,02 % | ||||||
| other | 1811 | 0,13 % | 2581 | 0,19 % | 4190 | 0,31 % | 4266 | 0,35 % | 0,35 % | 4458 | 0,39 % | 0,41 % |
| indicated nationality | 1444747 | 100,00 % | 1365779 | 100,00 % | 1347753 | 100,00 % | 1214693 | 98,92 % | 100,00 % | 1079695 | 93,55 % | 100,00 % |
| did not indicate nationality | 8 | 0,00 % | 1 | 0,00 % | 1 | 0,00 % | 13217 | 1,08 % | 74419 | 6,45 % |